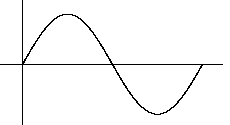
Drawing Trig Functions - sin, cos, tan

to do
; A programme to draw sin, cos and tan curves.
; You must manually enter the name of the trig function into
; the procedure called "to plot".
; jfuller EDUCATIONAL 1999
cs
pu
home
pd
initialise
grid
do.while [increment plot] [:angle<360]
; The "do.while" loop carries out the action "increment"
; and then calls the procedure "plot", repeatedly until the
; condition in the last set of brackets is satisfied.
end
to grid
; Draws a simple X-Y axis
fd 400
bk 800
home
rt 90
fd 400
bk 800
home
end
to increment
;increments the values of the angle and the X position
make "angle :angle + 1
make "Xvalue :Xvalue + 1
end
to initialise
; Sets all the intial values for the variables used.
make "angle 0
make "Yvalue 0 ; This is the value of the X-axis
make "Xvalue 0 ; This is the value of the Y-axis
end
to plot
make "Yvalue (sin :angle)
; ********************
; Substitute "sin", "cos" and "tan" to draw
different graphs
setpos (list :Xvalue :Yvalue * 100)
end
NOTE: You should be able to make the plot
look much better by adding values to the axes and perhaps setting up a
'grid' system by drawing a series of horizontal (X-axis) and vertical (Y-axis)
lines.